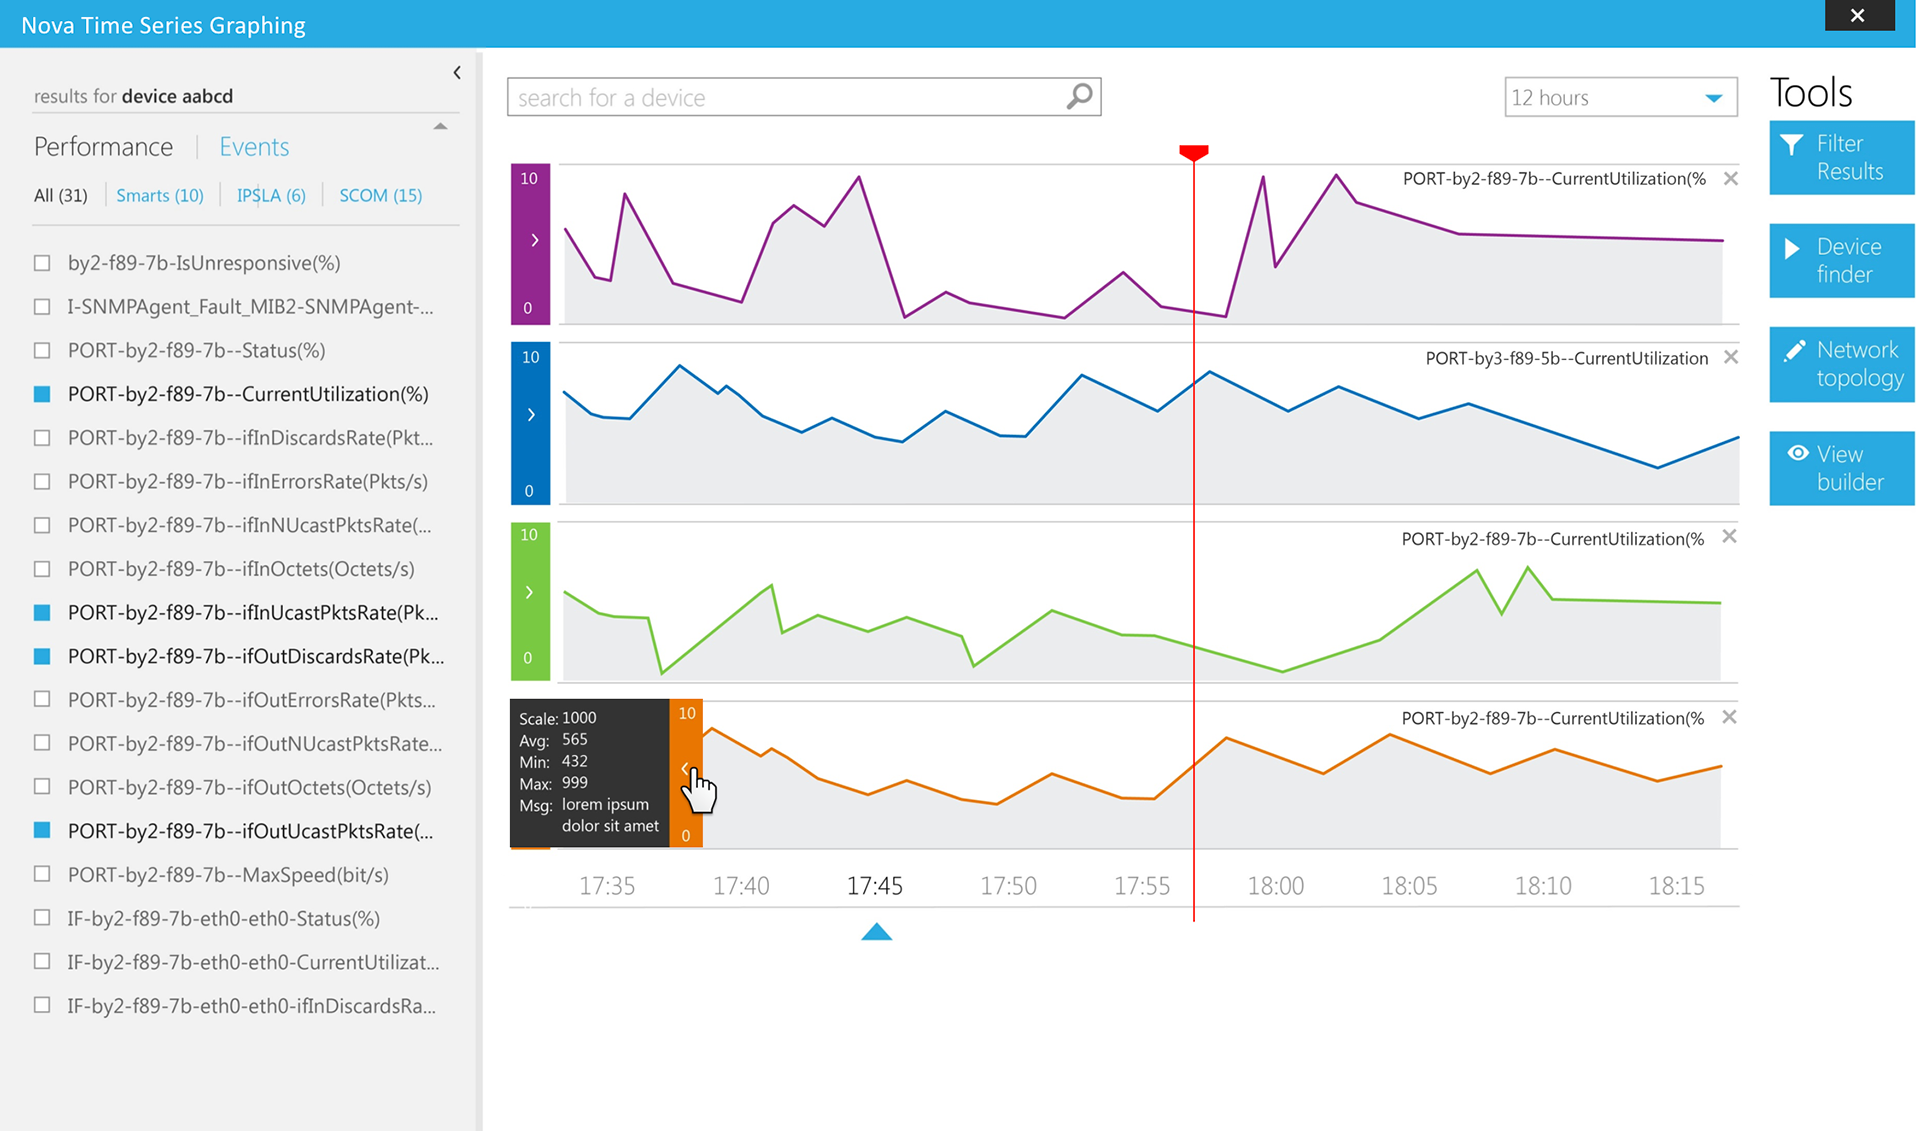
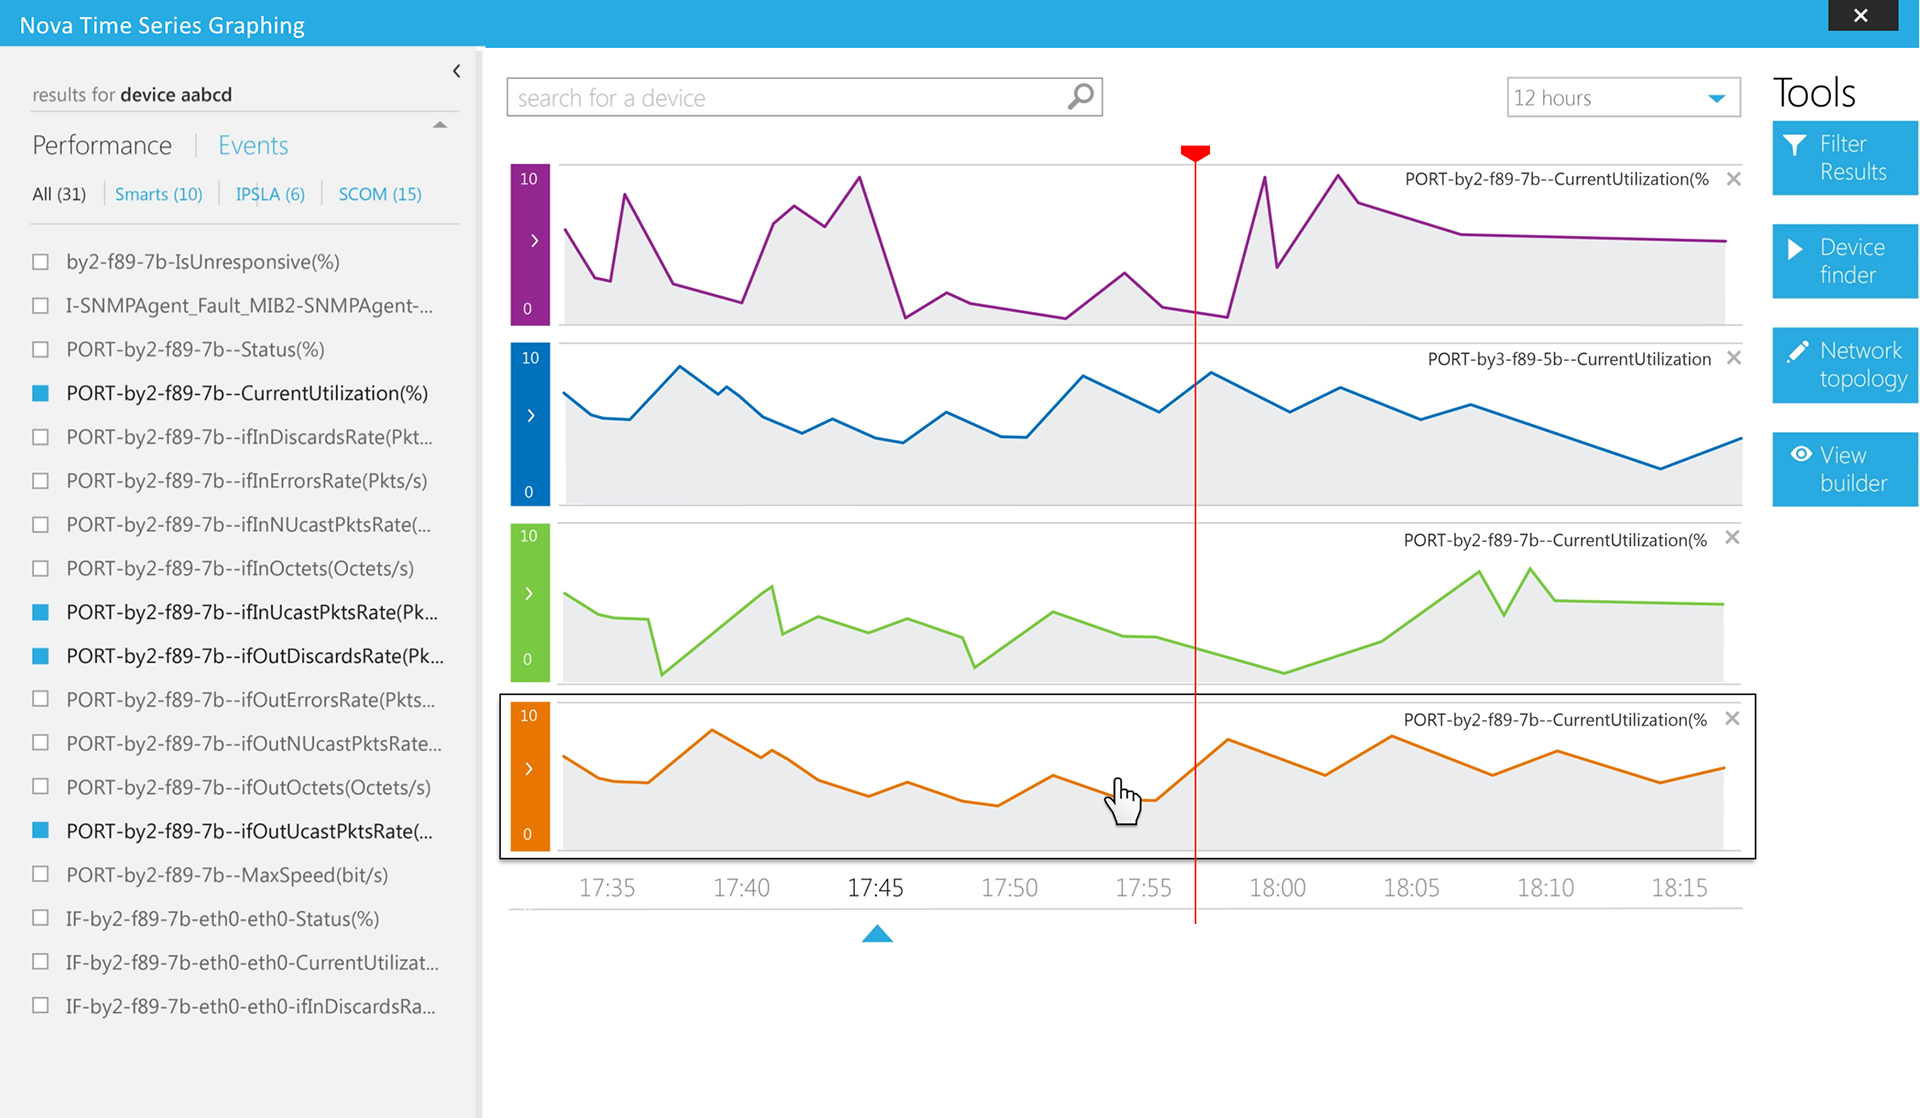
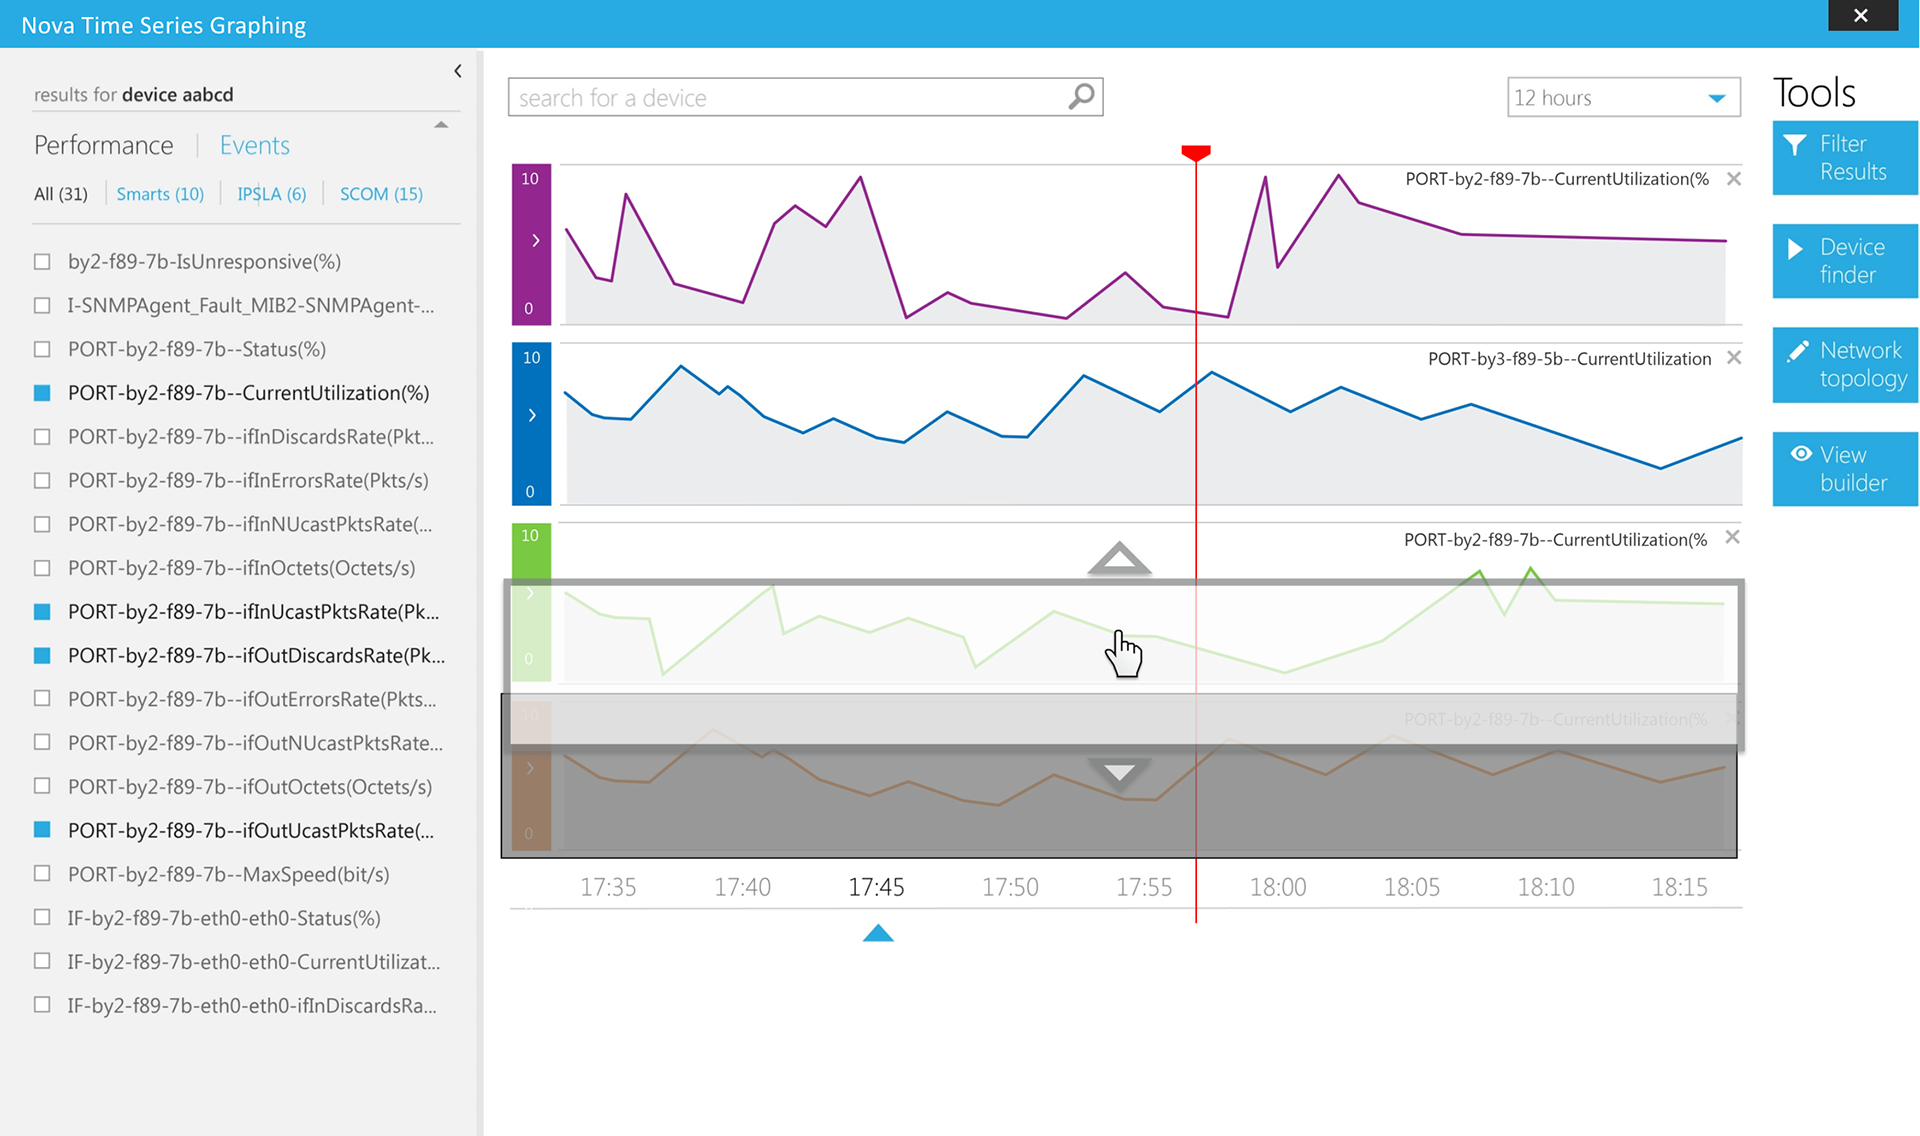
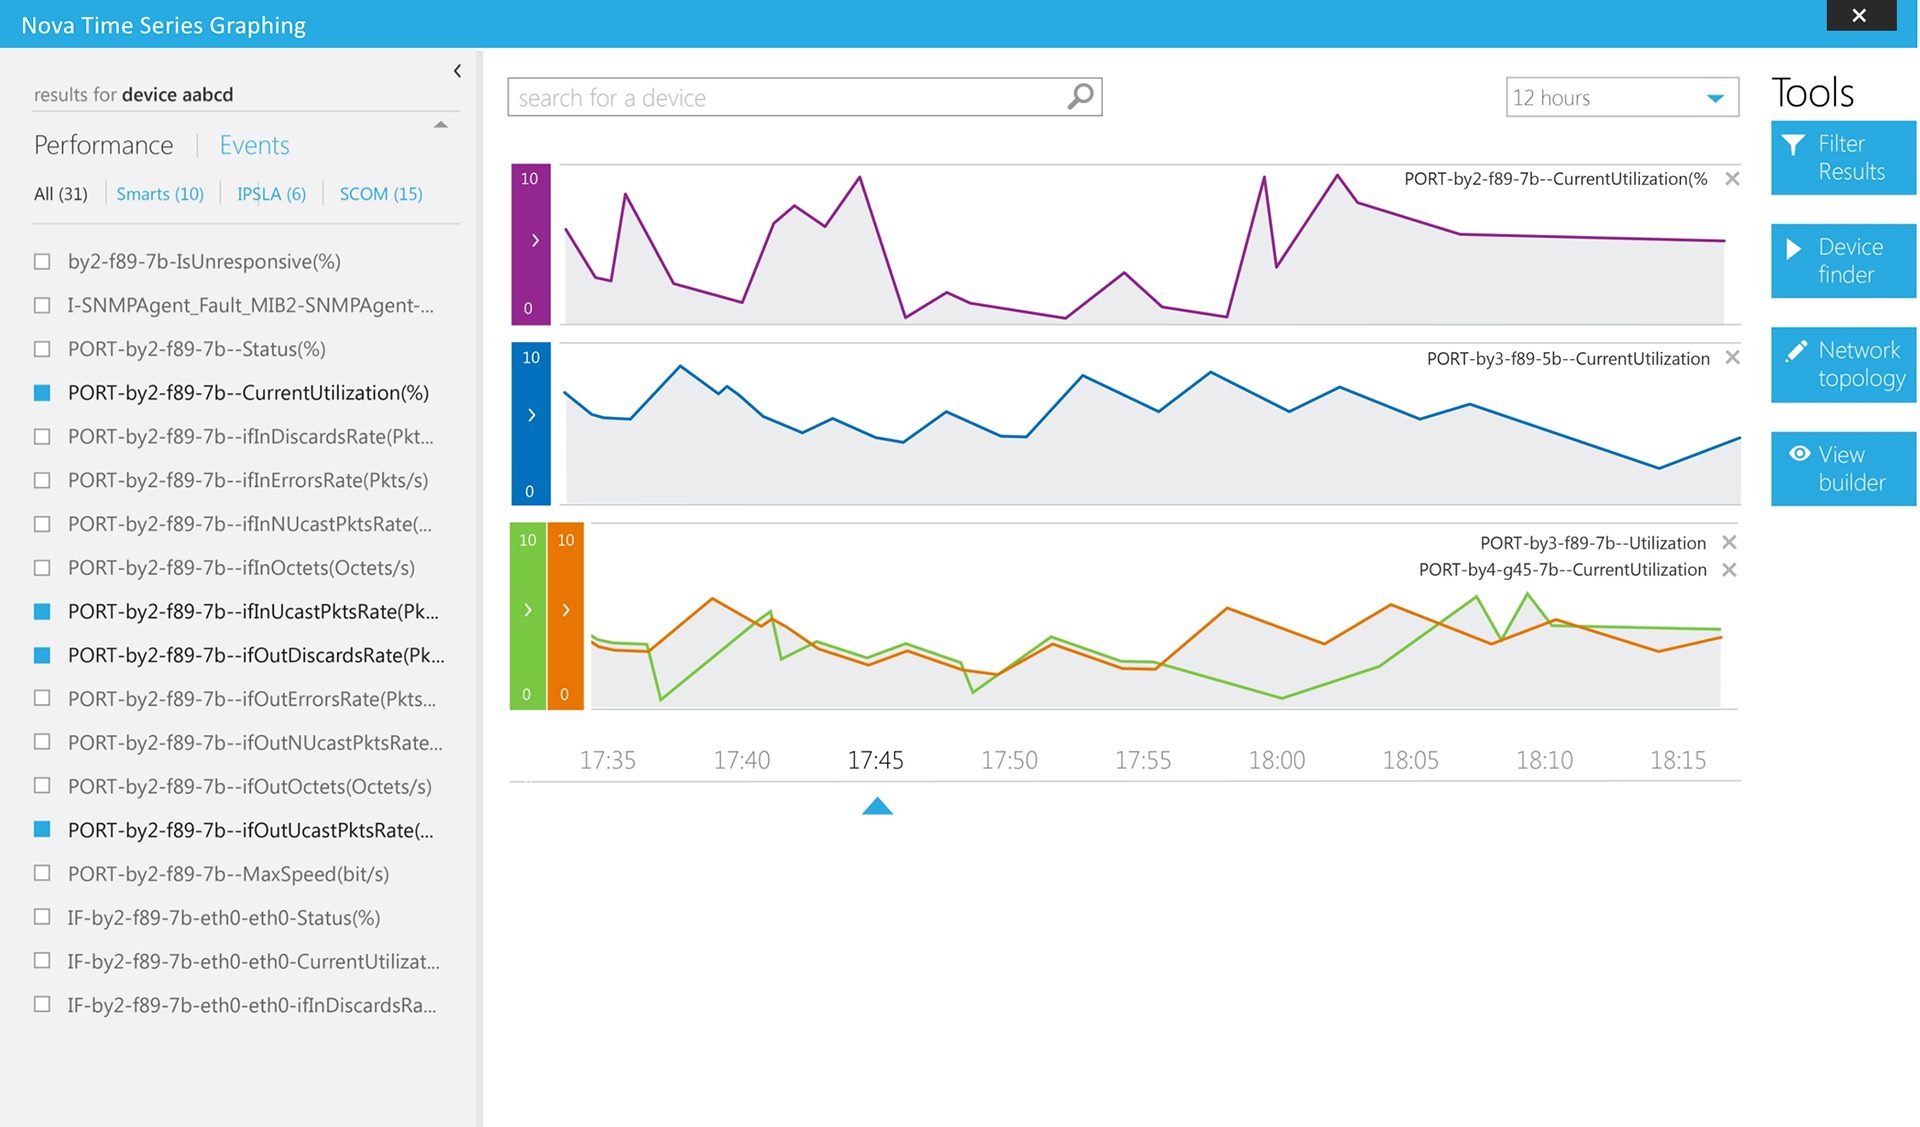
The visualization of time series data can offer unique challenges for the comparison of events with greatly differing scale. Large events can force a y-axis to scale such that events of smaller scale become nearly indecipherable. This wireframe explores an option for viewing and interacting with time series graphs with different y axes.