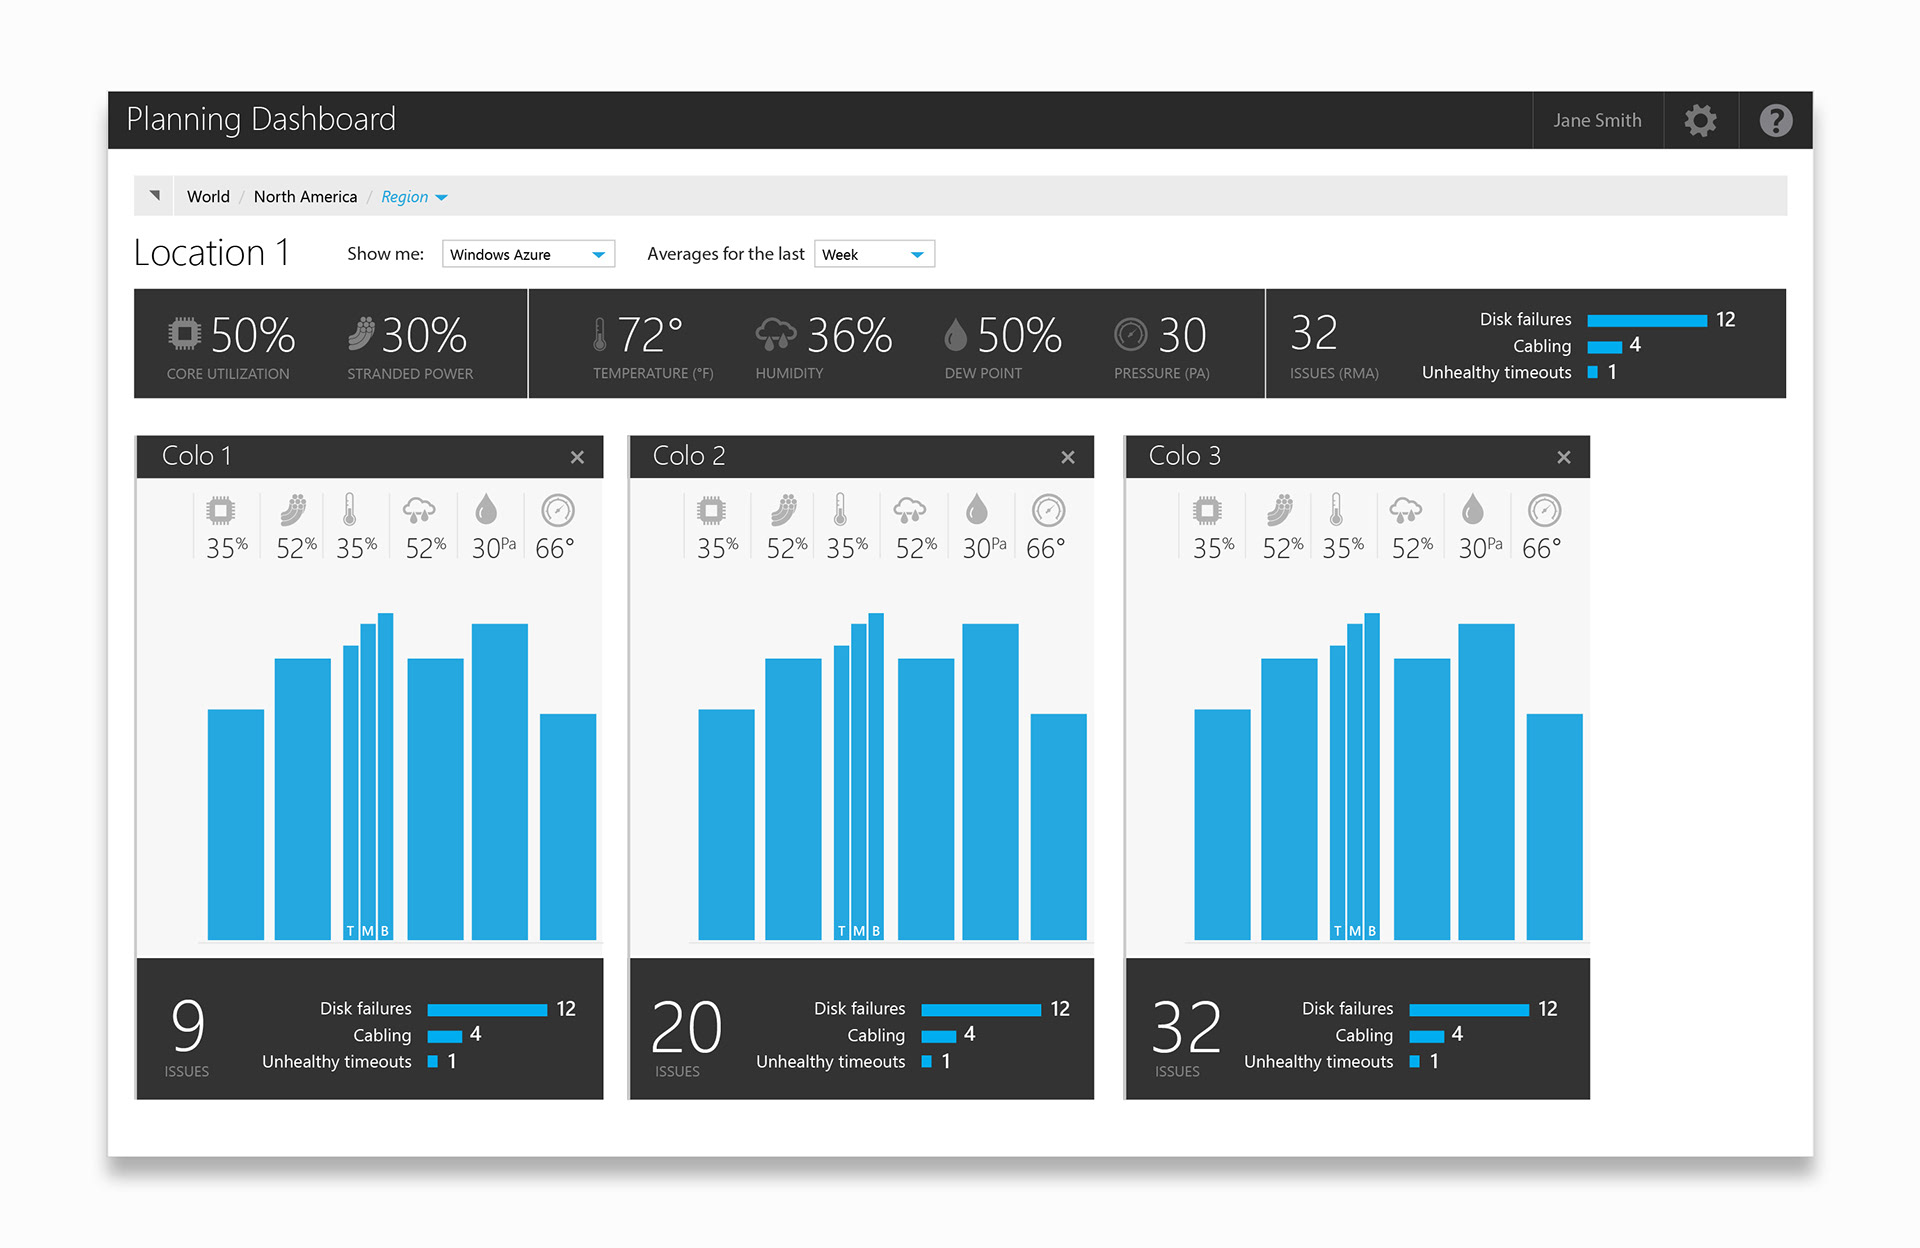
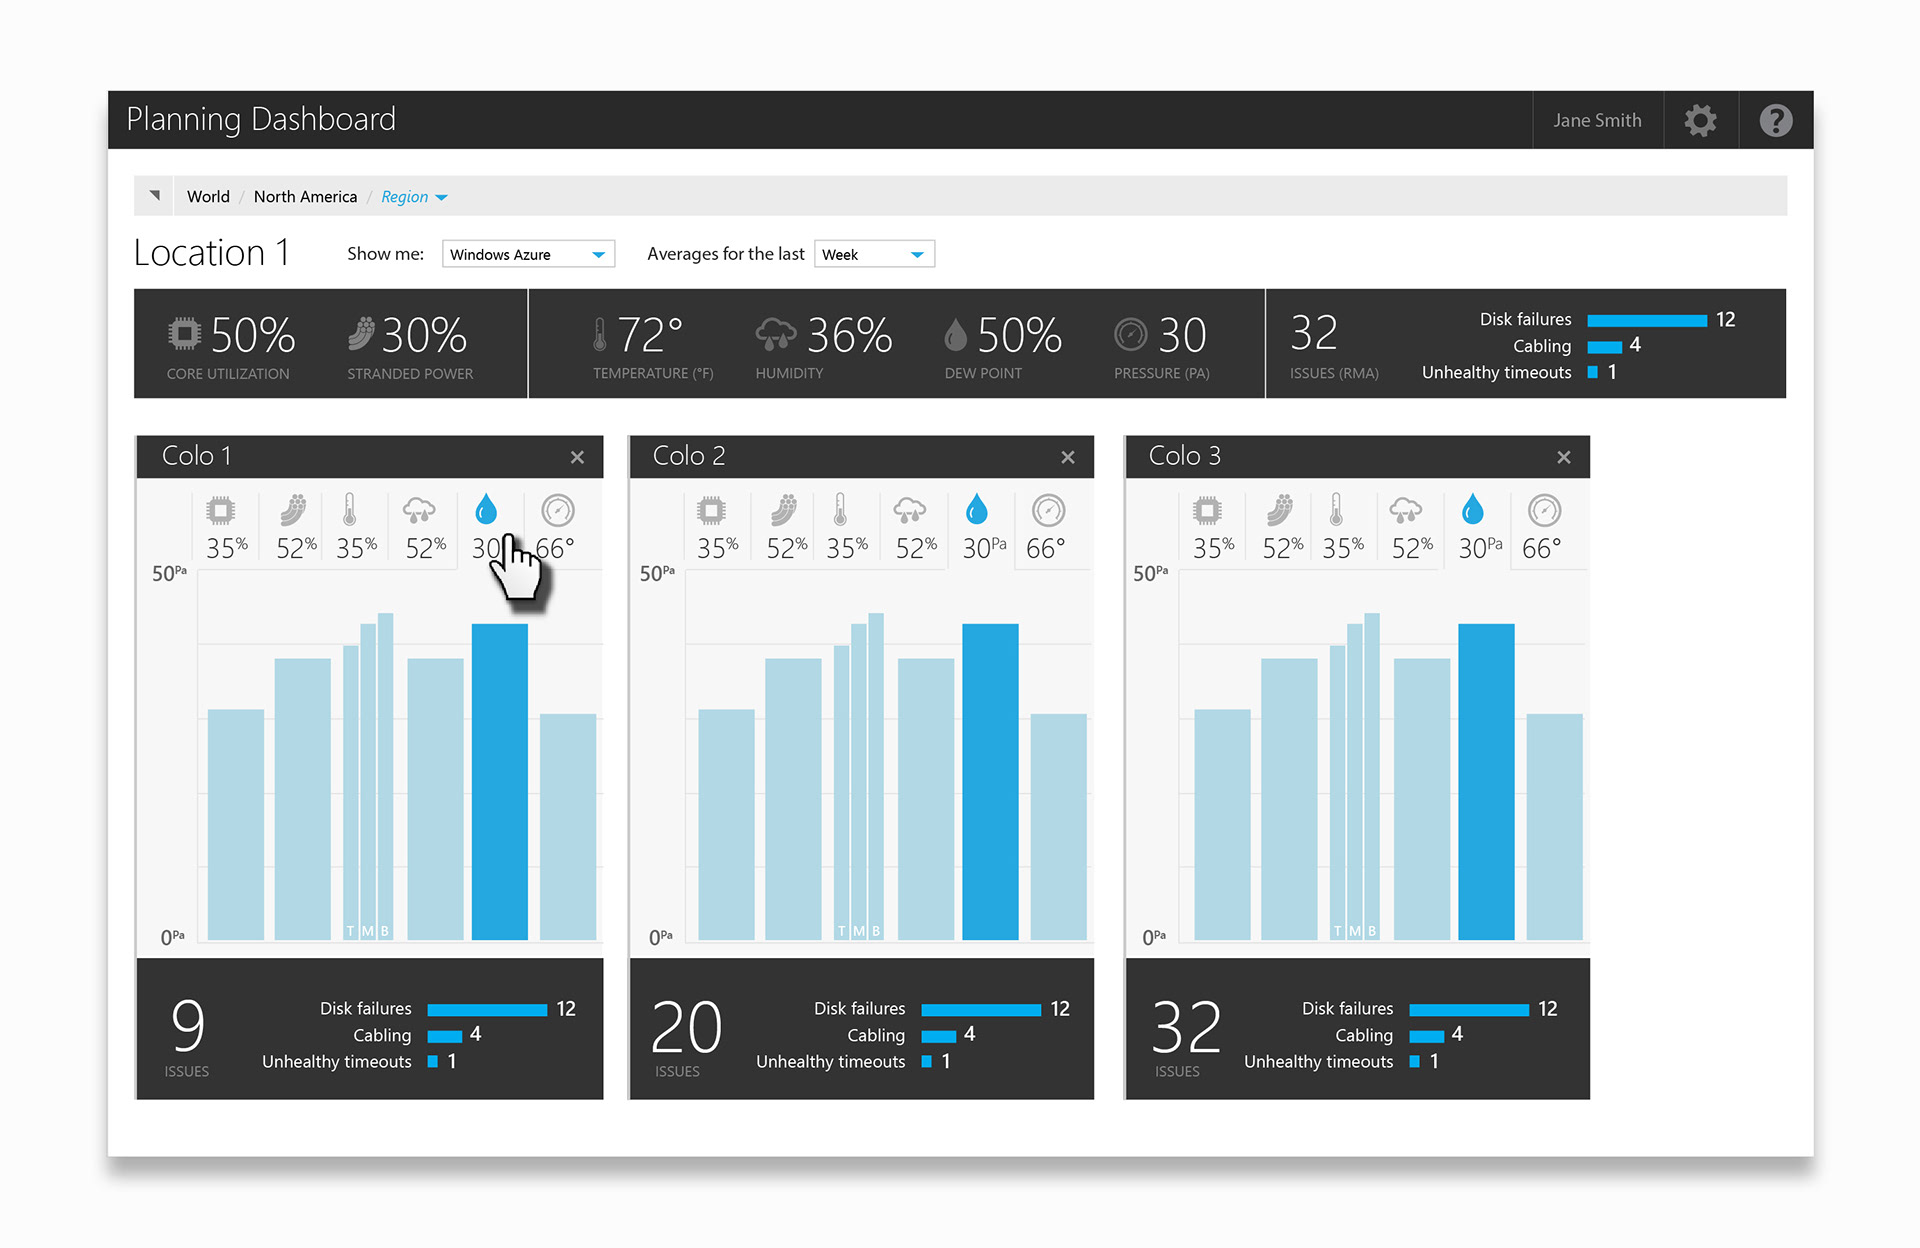
Analyzing correlation data is critical for effective incident management and performance optimization. Finding relationships between metrics with varying indices and thresholds is often a very manual process of data analysis. This design allows users to capture a simple visualization of comparable metrics across entities and to pivot indices based on a selected metric.